*Geek Box: Using Z-scores in Research
To understand and interpret the findings in this study, it will be helpful to get to grips with standard scores, known in research as “z-scores”. Calculating z-scores is based on the normal distribution of data, as shown in the figure below.
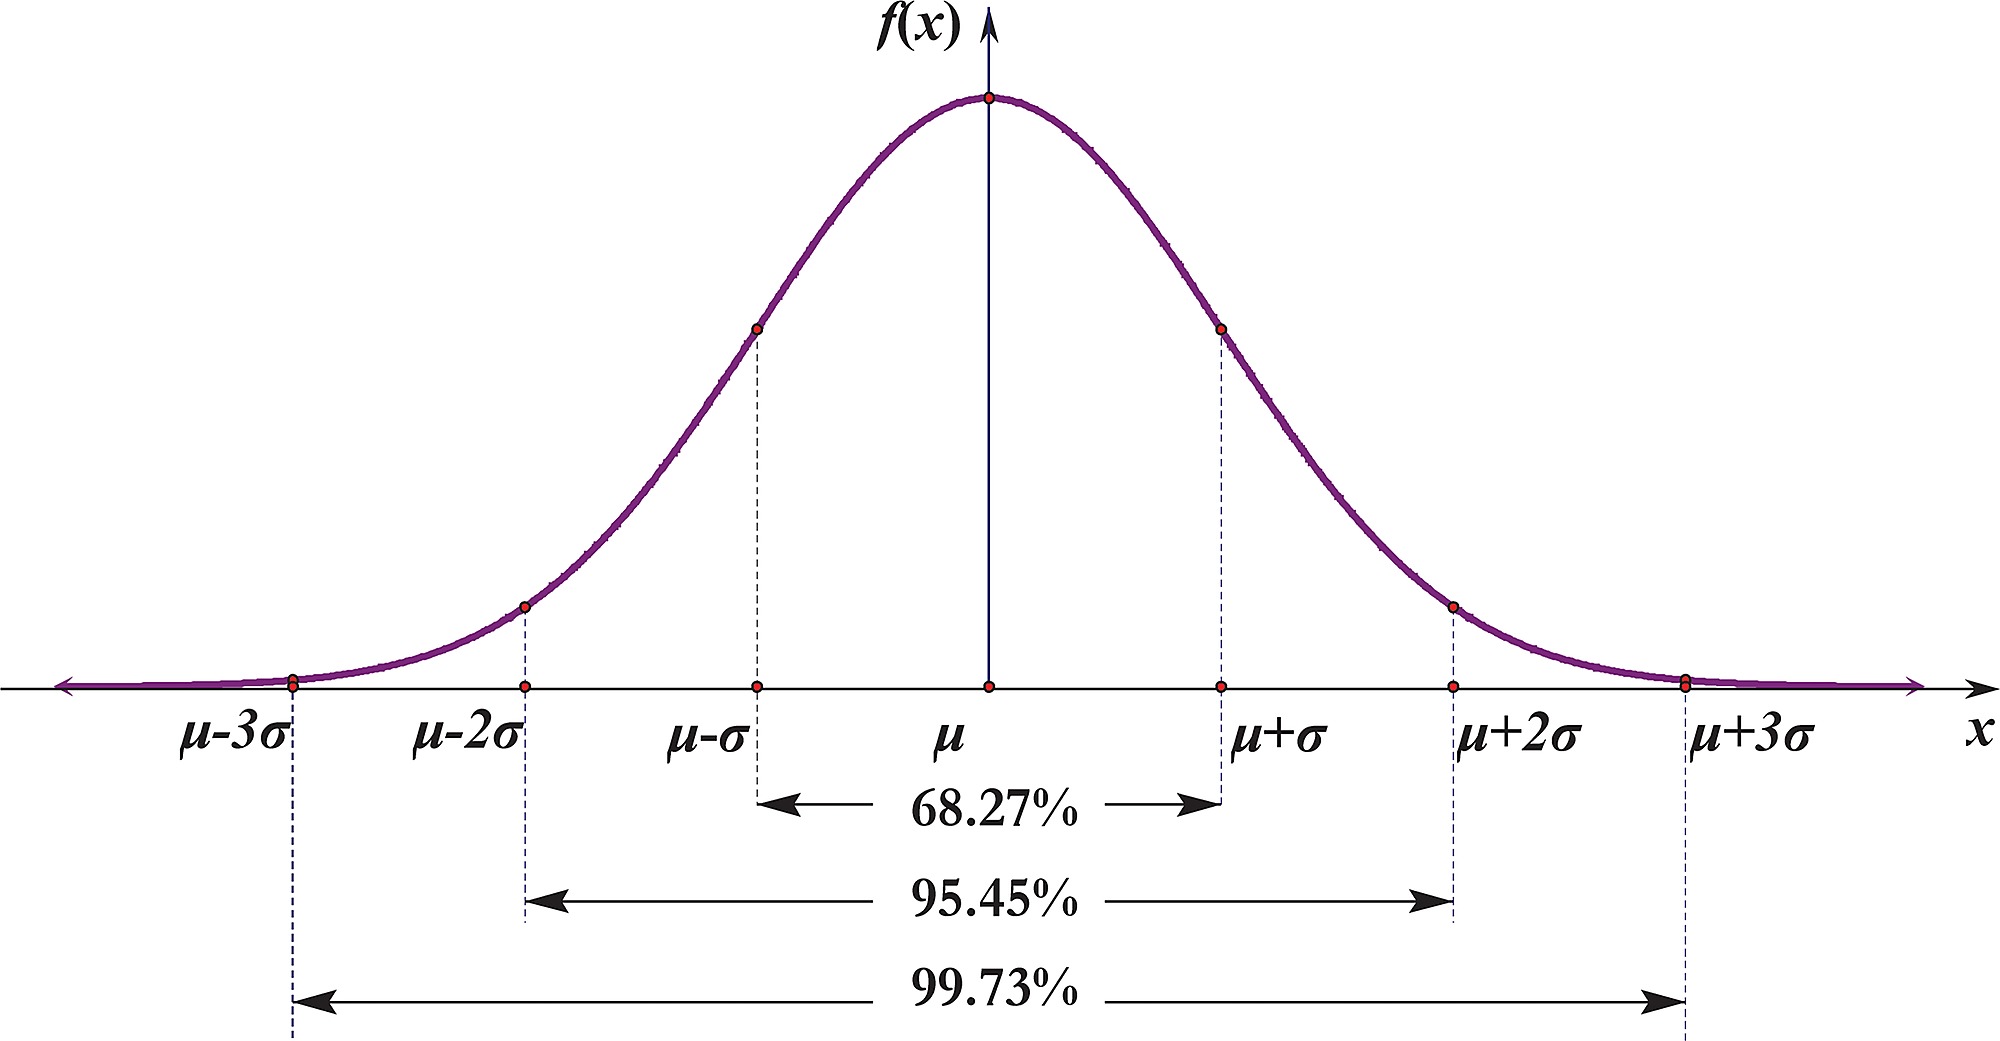
A normal distribution appears as a bell-curve shape; ignore the Latin text, and just look at the lines and numbers. In the centre we have the mean; this could be the average height, weight, or blood pressure, in the population. The dashed lines on either side of the mean are the standard deviation [SD] from the mean, i.e., what proportion of the data varies from the mean, and by how much. In a normal distribution, the variance is equal either side – above and below – the mean. Thus, you can see that 68.27% is within 1-SD from the mean; 95.45% within 2-SD; and 99.73% within 3-SD.
A “z-score” takes a set of data and standardises it to a normal distribution. Let’s bring this to life with an example. Assume we are interested in a test that assesses memory by testing the ability of participants to recall up to 10 words. Thus, the possible scores range from 0 to 10. Let’s say the mean score in the study was 5, and the SD was 3. One participant has scored 6; we might intuitively think that 6/10 is a good score, but how do we know how it compares to the overall study group?
This is where researchers will calculate a z-score. The participant’s z-score is calculated as; 6 [the score] minus 5 [the mean], divided by 3 [the SD]: 0.33. By calculating a z-score for every participant, it is then possible to use these scores to compare how well that participant did compared to others. If another test was used that scored on a different scale, it would also be possible to calculate z-scores for that test to then compare how participants scored on both tests.